Diagram in the Horizontal Coordinate System
After sending the request by clicking the DRAW STAR PATH button, our server will return a diagram and a data table. The information about the querying location, date, and target will be displayed above the diagram.
As this project is open-source and non-commercial, our server is hosted under a free plan. Therefore, the connection and processing times may occasionally be longer than expected. However, results are typically available within a few seconds at most.
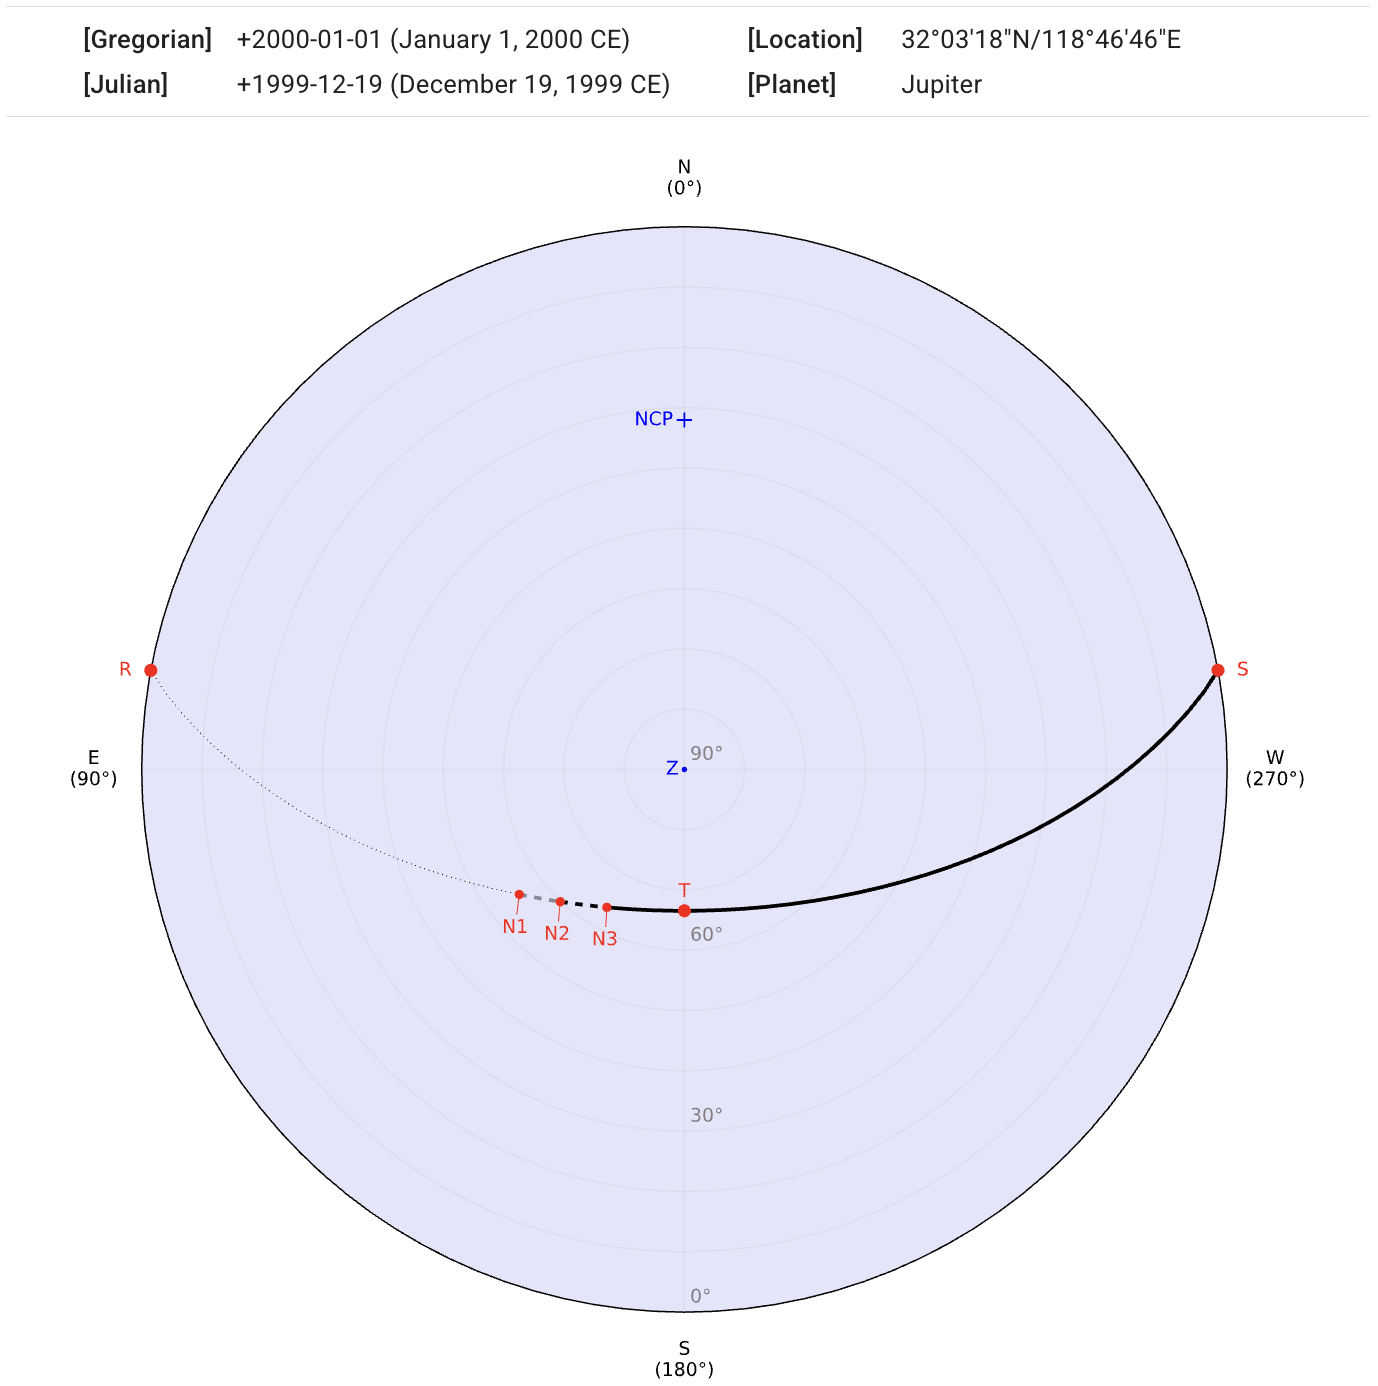
The path of the star’s apparent motion is projected onto a horizontal coordinate system, where angles altitude (alt.) and azimuth (az.) are the two independent coordinates. The outermost outline on the diagram represents the horizon observer’s local horizon. The north and south celestial poles (labeled NCP and SCP) and the zenith (labeled Z) are shown if they are within the coordinate range.
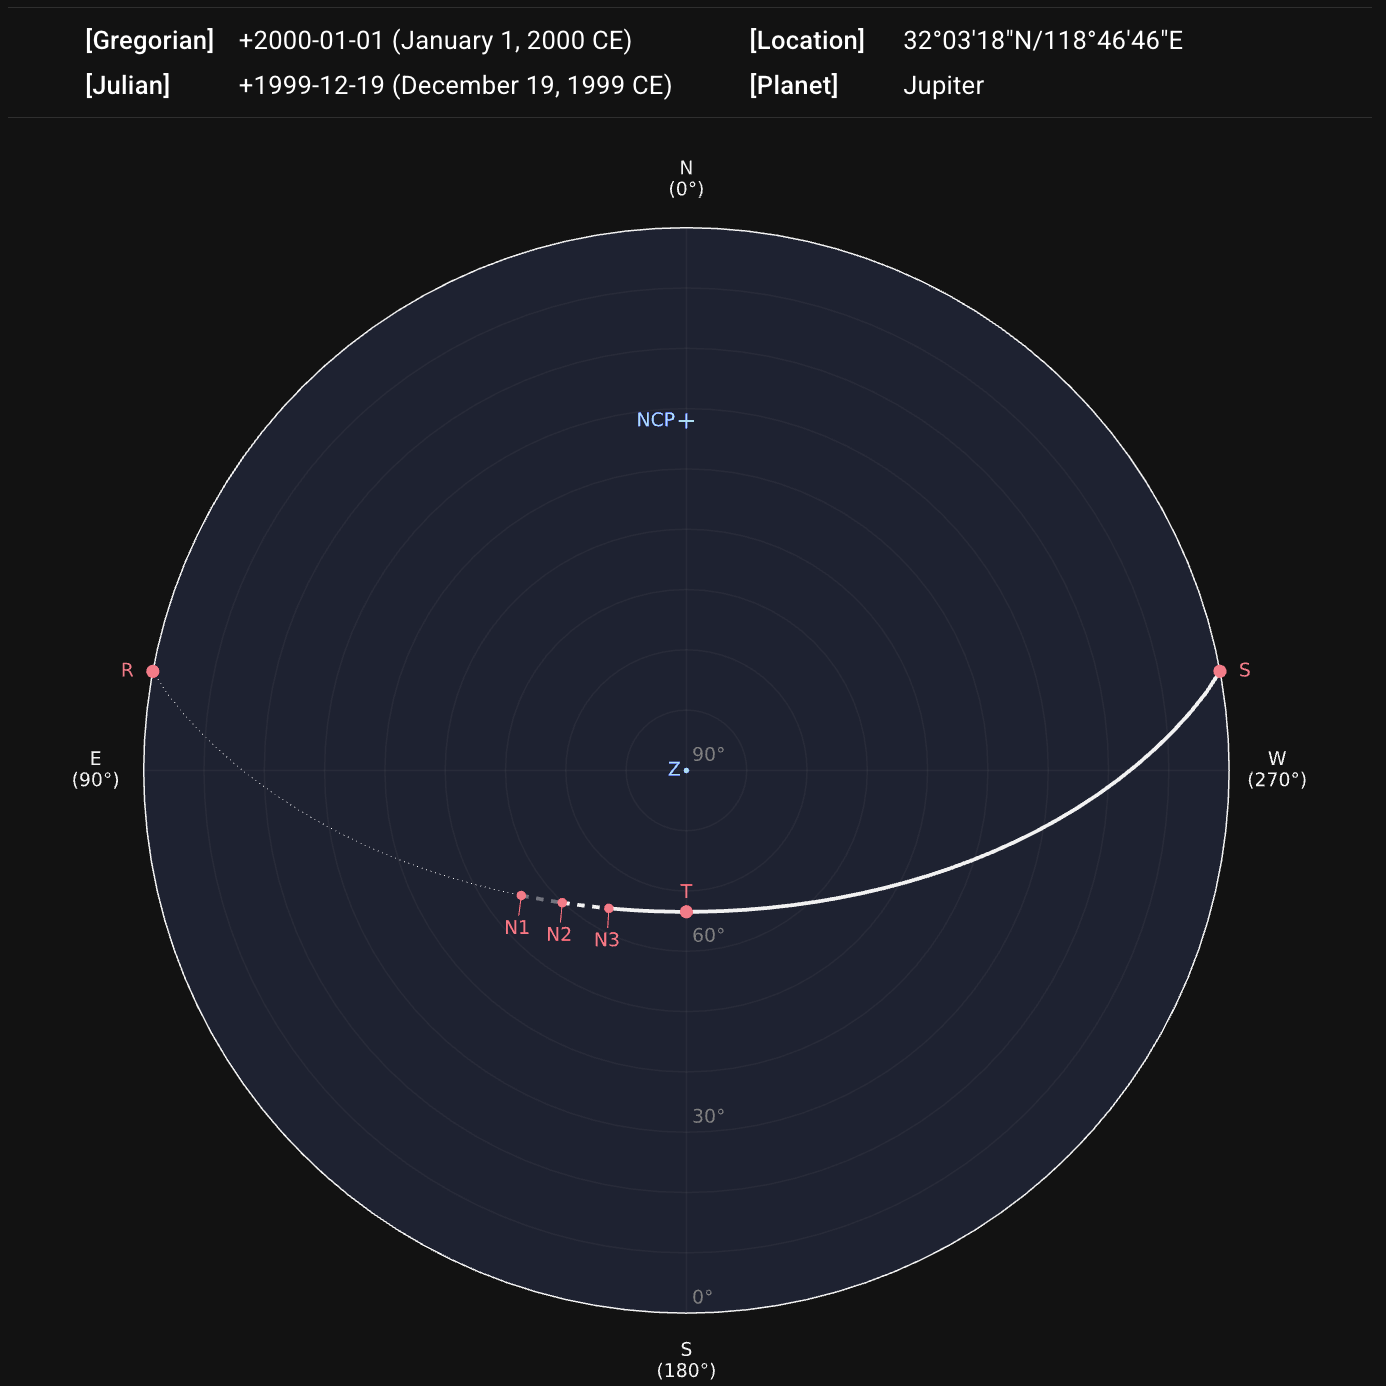
Diagram Example
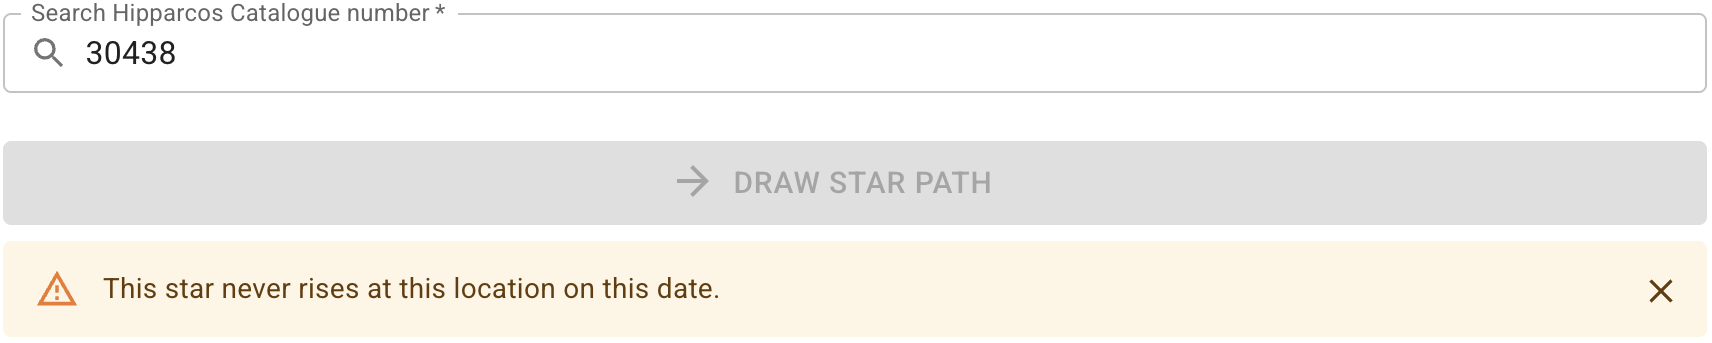
If the querying star never rises on the given date observed from the certain location, it warns:

Date in the Chinese Calendar
If the querying date is able to be converted to the Chinese calendar, the converted date is placed as a tooltip. Hovering on the Gregorian or Julian date (or tapping on mobile devices) shows it.


Legend and Table of Coordinates and Times
The path segments are depicted in different styles according to the twilight types. The star positions at rising, setting, and meridian-transit are marked as points on the diagram as well. A legend and a table containing coordinates and times of these points are appended to show more details.
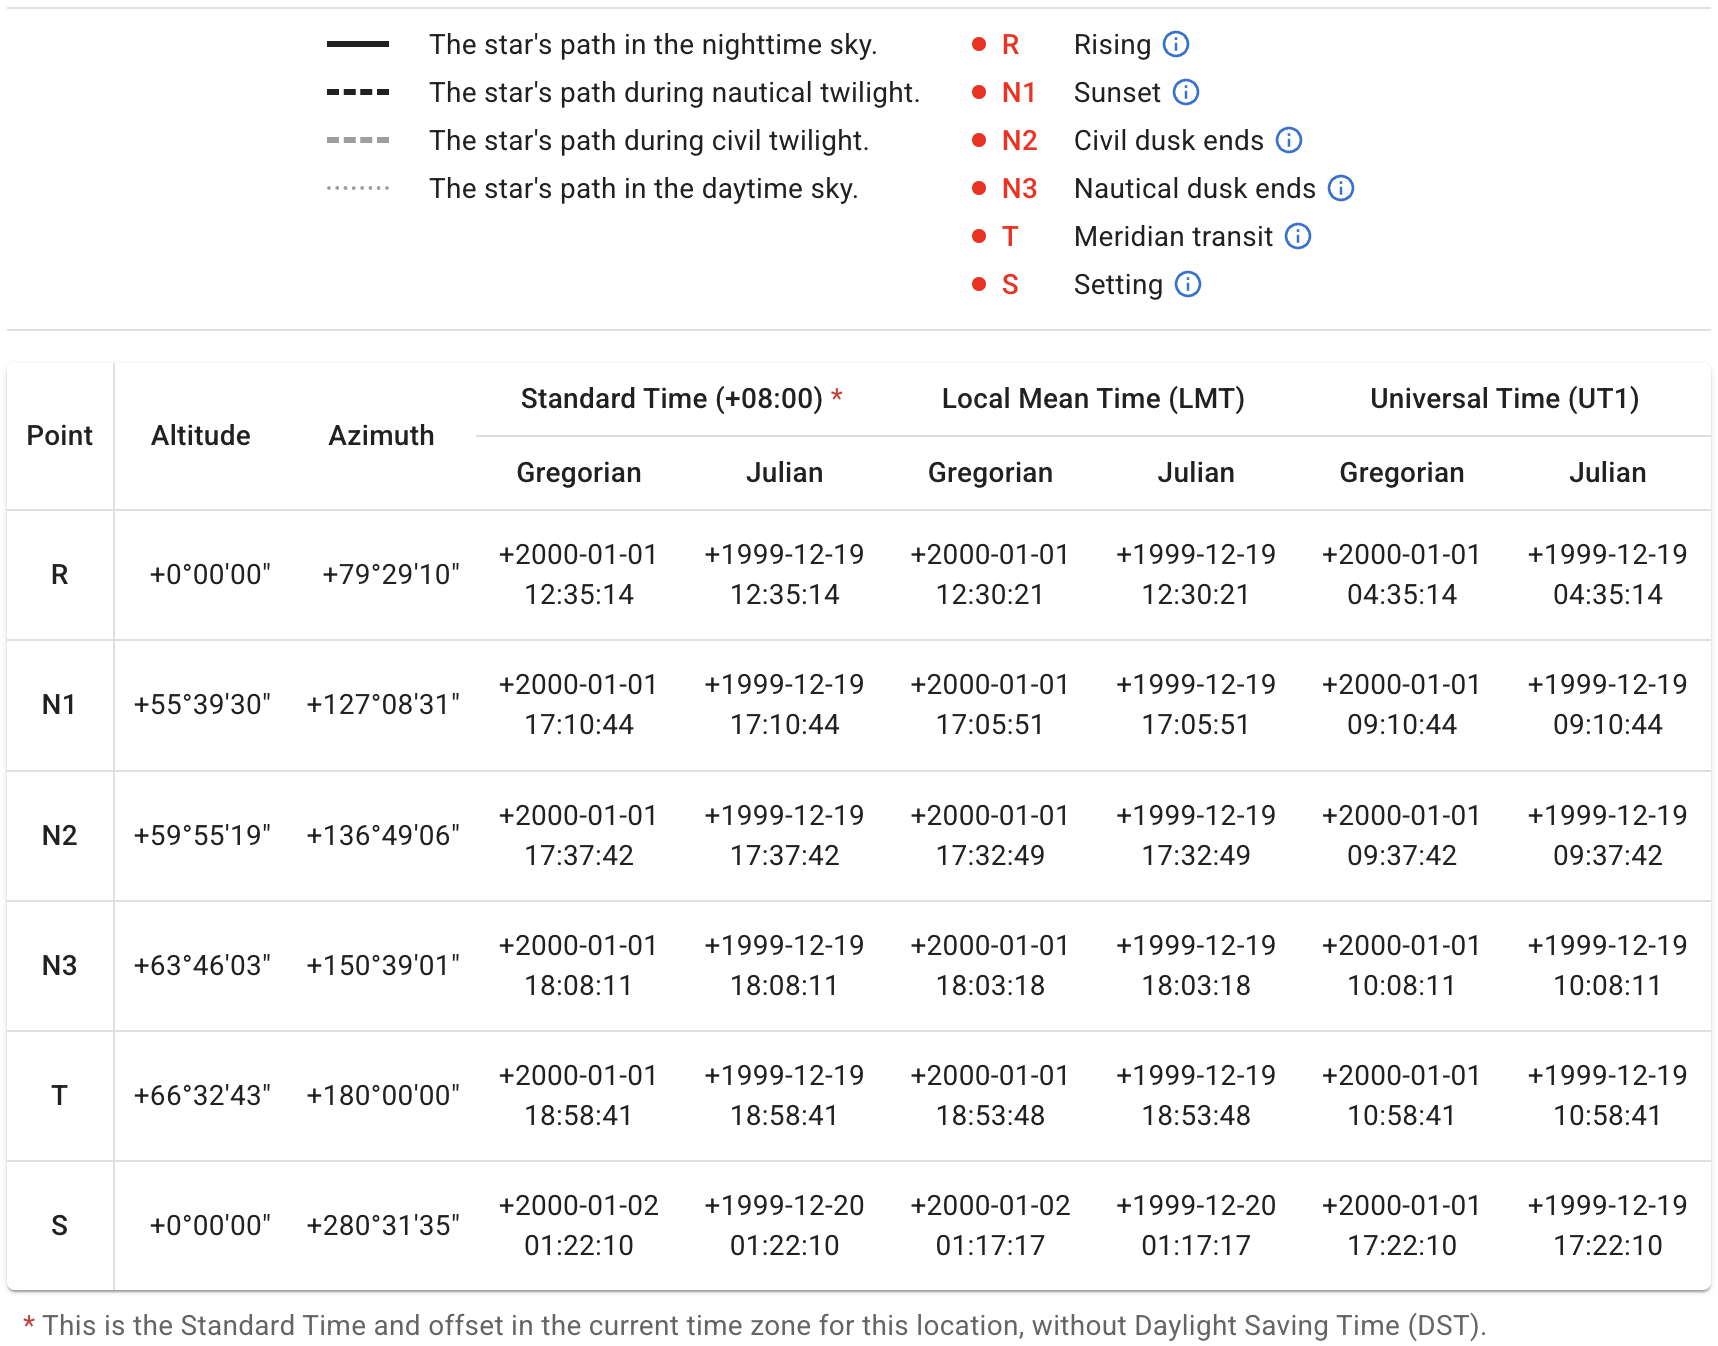
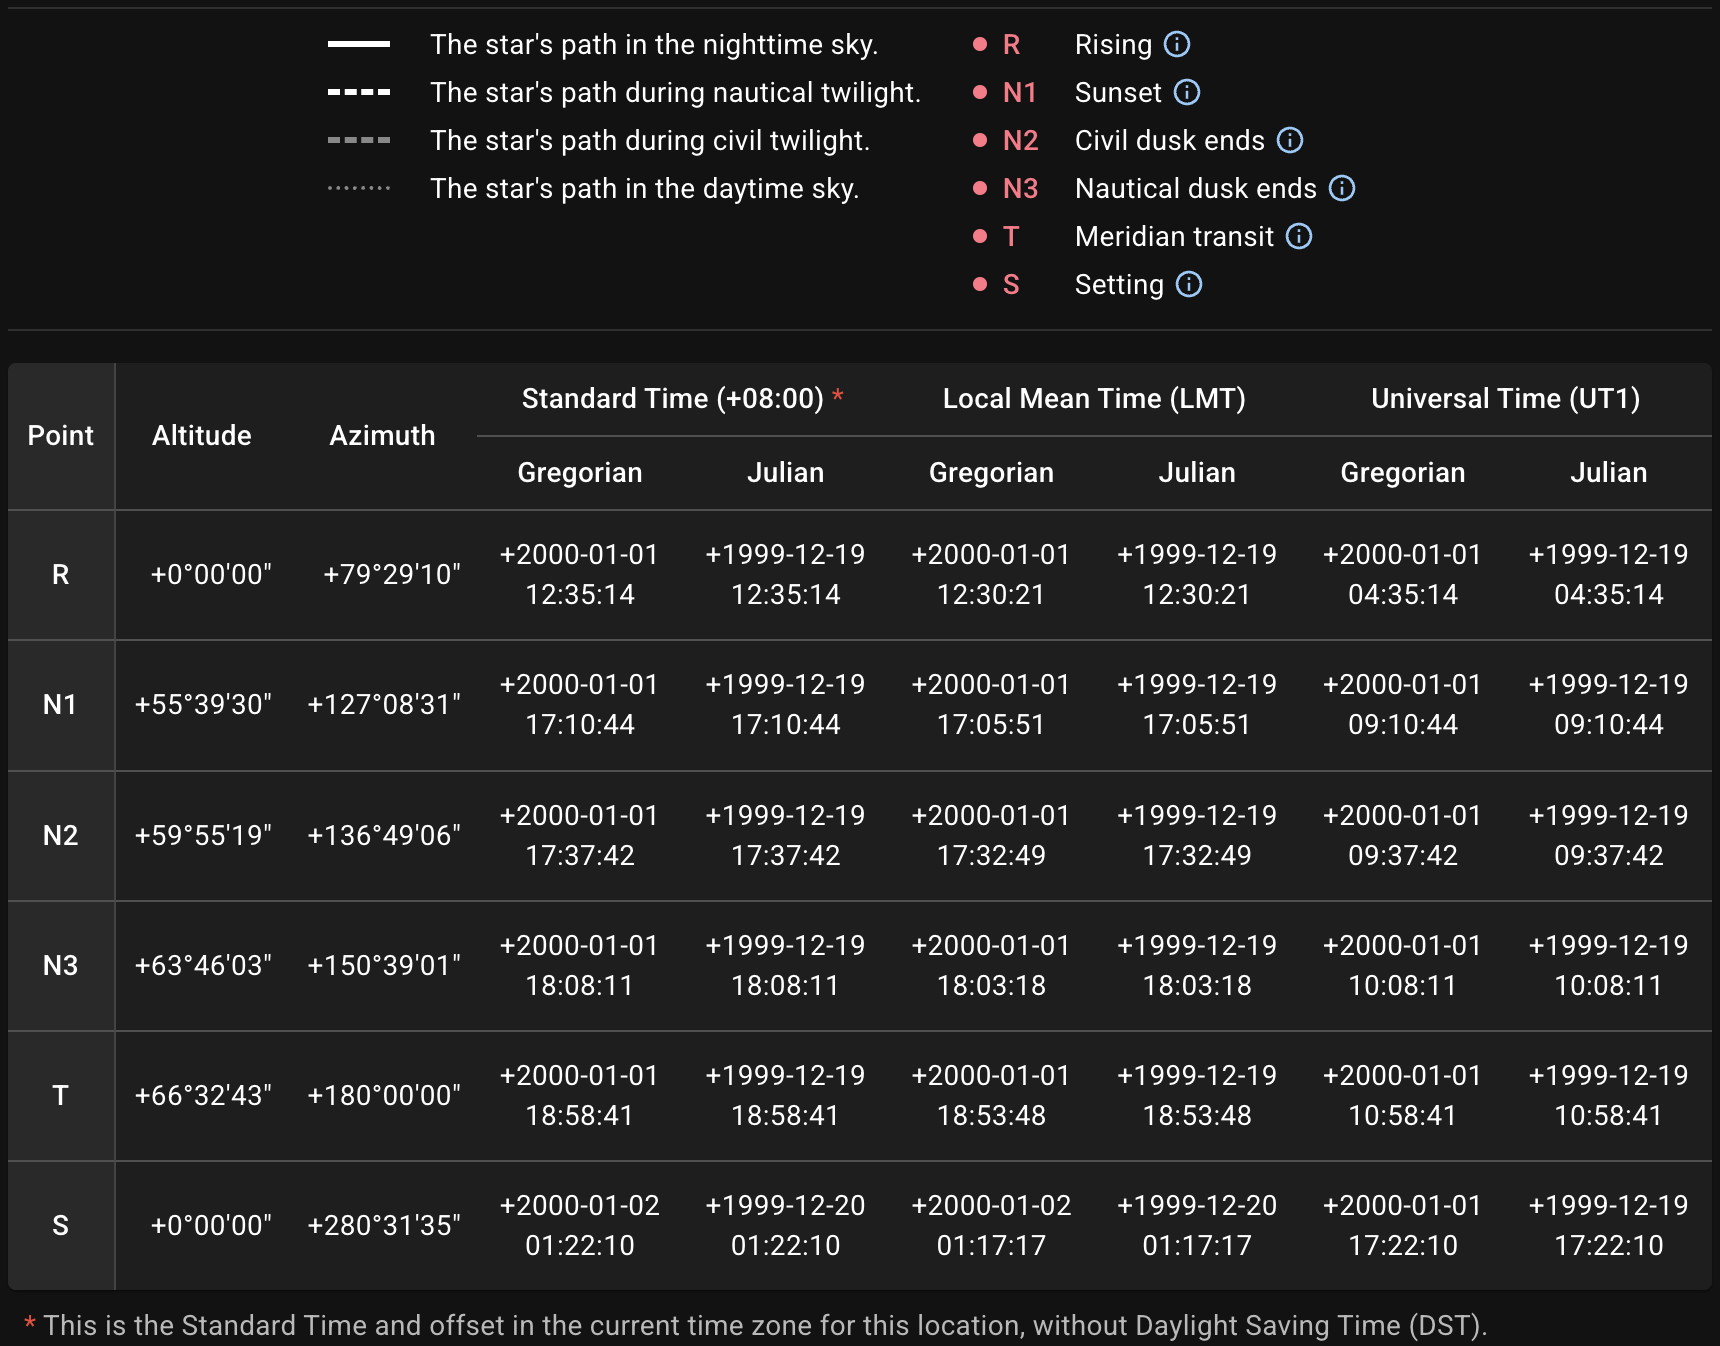
Hovering on the ⓘ icon (or tapping on mobile devices) shows an explanation of this point label. See Conventions section for reference.


The Local Mean Time (LMT) in the table is derived directly from the observer’s latitude and longitude.
About the Standard Time, see Time Zone section for details.
The atmospheric refraction has been taken into account in the position calculation. See Altitude Calculation for more details.
Export
The diagram can be exported as SVG, PNG, or PDF. The table can be exported as CSV, JSON, or XLSX. The number in the filename, e.g., 1777589177.716, is a Unix timestamp representing the creation time of the results and is the same across both the exported image and table.
The information about this query will be embedded as the metadata in SVG:
<metadata>
  <title>sp_1777589177.716</title>
  <desc>Date (Gregorian): +2000-01-01</desc>
  <desc>Location (lat/lng): 32.055/118.779</desc>
  <desc>Celestial Object: Jupiter</desc>
</metadata>
or as the Description of the document properties in PDF:
Location (lat/lng): 32.055/118.779,
Date (Gregorian): +2000-01-01,
Celestial Object: Jupiter